
How business process simulation supports data-driven decision making
Written by Teresa Montrone
13 February 2026 · 8 min read

Today, you have access to more data than ever. But having data does not automatically mean making better decisions. The real challenge is knowing how to turn numbers into actions that actually improve the way your business works.
That is where data-driven decision making comes in. It helps you rely on evidence instead of assumptions, using clear goals, structured analysis, and measurable results. However, many teams still struggle to connect data analysis with real, operational decisions that affect daily work.
This gap is exactly where business process simulation becomes useful. With Cardanit, you can simulate how your processes really run, generate realistic data, and test different decisions before applying them in the real world. Therefore, data-driven decision making stops being abstract and starts becoming something you can actually use.
This article is written for business analysts, process owners, and teams involved in improving business processes who want to make decisions based on data, not assumptions. It focuses on understanding concepts first, before moving toward practical application.
What is data-driven decision making and how you can make it
Data-driven decision making (DDDM) means making choices based on facts instead of guesses or gut feelings. You use reliable data to evaluate options, predict outcomes, and choose actions that improve measurable business results. In today’s business environment, this approach helps teams make more consistent and reliable decisions.
In practice, data-driven decision making usually follows four main steps.
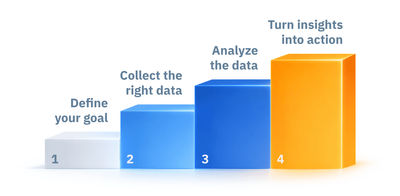
1. Define your goal
First, be clear about the problem you want to solve and the questions you need to answer. Clear goals help you stay focused and guide your next steps.
2. Collect the right data
Once your goal is defined, gather the data you need. This also means tidying it up – getting rid of any mistakes, duplicates, or irrelevant information, so you have good, clean data to work with.
3. Analyze the data
After preparing the data, you can start exploring it. You look for patterns, trends, and anomalies. Depending on your objective, different types of analysis can help:
- Descriptive analysis tells you what happened in the past.
- Diagnostic analysis helps you figure out why things happened.
- Predictive analysis tries to guess what will happen next.
- Prescriptive analysis even suggests the best actions to take!
4. Turn insights into action
The final step is understanding what the data is telling you and turning that into real decisions. You then put those decisions into action. After implementation, it is important to monitor results and adjust if needed. Therefore, decision making becomes an ongoing process, not a one-time action.
Data visualization techniques to make data-driven decision
There are many ways to visualize data. Choosing the right one helps you understand patterns faster and explain results more clearly. However, each chart works best for a specific purpose.
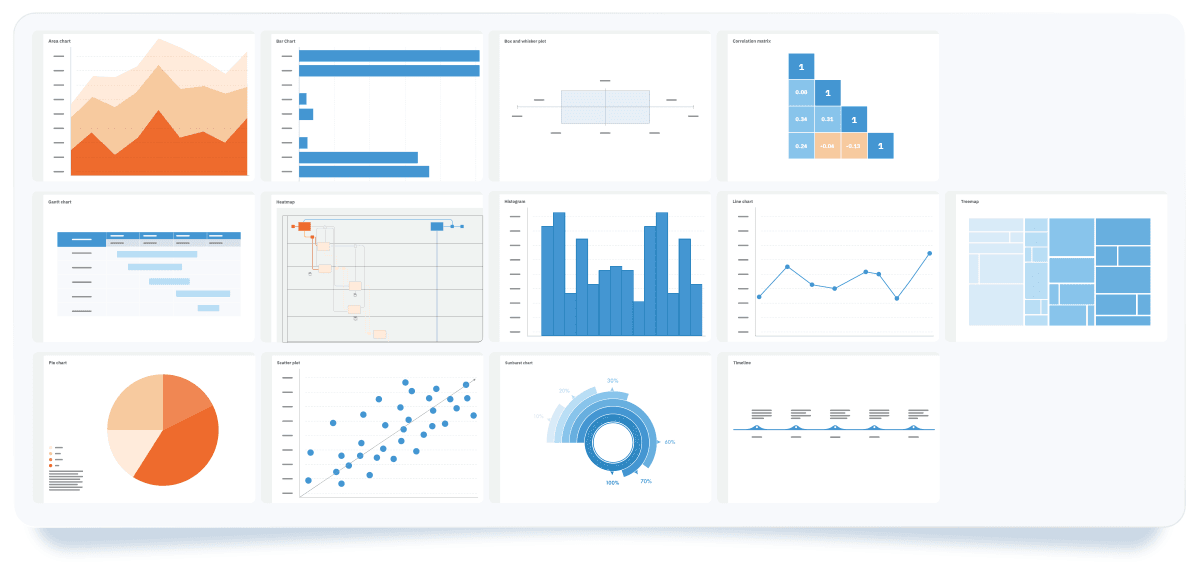
Below are some of the most commonly used data visualization techniques and when to use them:
- Area chart: shows totals over time by filling the space under a line. It is useful for comparing multiple data series and identifying trends.
- Bar chart: compares different categories by showing their values side-by-side, making it easy to see which is bigger or smaller.
- Box and Whisker plot: gives you a quick statistical overview using quartiles. There's a box in the middle showing the main range, with a line for the average, and "whiskers" reaching out to the highest and lowest values. Any odd values (outliers) are plotted individually. It helps you see if your data is spread out evenly or leaning one way.
- Correlation matrix: shows the relationship between variables in a grid format. Color intensity indicates the strength and direction of each relationship, making connections easier to understand.
- Gantt chart: plots tasks against a timeline, giving you a clear picture of project schedules and how things are progressing.
- Heatmap: colors elements based on how big their values are, making it simple to quickly spot patterns and trends in lots of data.
- Histogram: shows how your data is spread across a continuous range, highlighting where values are concentrated, where there are gaps, and any unusual data points.
- Line chart: connects data points with a line, making it easy to see growth, decline, and repeating patterns.
- Pie chart: shows how each category contributes to a whole "pie," making it simple to compare different parts.
- Scatter plot: shows the relationship between two things by plotting them as individual points. It works for finding trends and connections.
- Sunburst chart: uses a series of rings inside each other to show data that has levels, giving you an easy way to see multi-level structures.
- Timeline: displays events in chronological order. It works well for presenting historical data or showing how things change over time.
- Treemap: shows hierarchical data using nested rectangles. The size of each rectangle represents its value, which makes it easy to compare categories and their subcategories at a glance.
Generally, charts can be grouped by what they do best:
- showing trends over time: line, area, Gantt charts, and timelines,
- comparing different categories: bar and pie charts,
- illustrating relationships between things: box and whisker plots, correlation matrices, heatmaps, histograms, and scatter plots,
- visualize hierarchies: treemaps and sunburst charts.
Therefore, the best chart always depends on what you're trying to figure out and what insights you want to get.
Use Business Process Simulation to support data-driven decisions
In business, making the right decisions has a direct impact on time, cost, and outcomes. DDDM supports this by grounding choices in data instead of assumptions. As explained earlier, DDDM provides a structured way to move from analysis to action.
At Cardanit, we've introduced business process simulation. Business process simulation is a technique used in Business Process Management to analyze how a process behaves under different conditions. It uses a simulated model of a real process to generate data about time, cost, resources, and performance before changes are applied in the real world.
Think of it as creating a digital twin of your process, a virtual copy of how things really work in your business. In this context, a digital twin is a virtual representation of a real business process that mirrors its structure, logic, and behavior. The digital twin generates data that closely reflects real operating conditions, helping you understand where you can make things better. As a result, business process simulation strengthens DDDM with realistic, testable insights.
How business process simulation works in practice
The process usually starts by defining a clear objective. Business analysts then model the process and generate data through simulation, based on the goal they want to achieve. Simulation parameters are set carefully, since they determine how closely the model reflects reality. Once simulations run, they produce measurable results. These results are analyzed using data visualizations, which makes patterns and trade-offs easier to understand. The insights gained support informed decisions, which can later be validated through real-world execution.
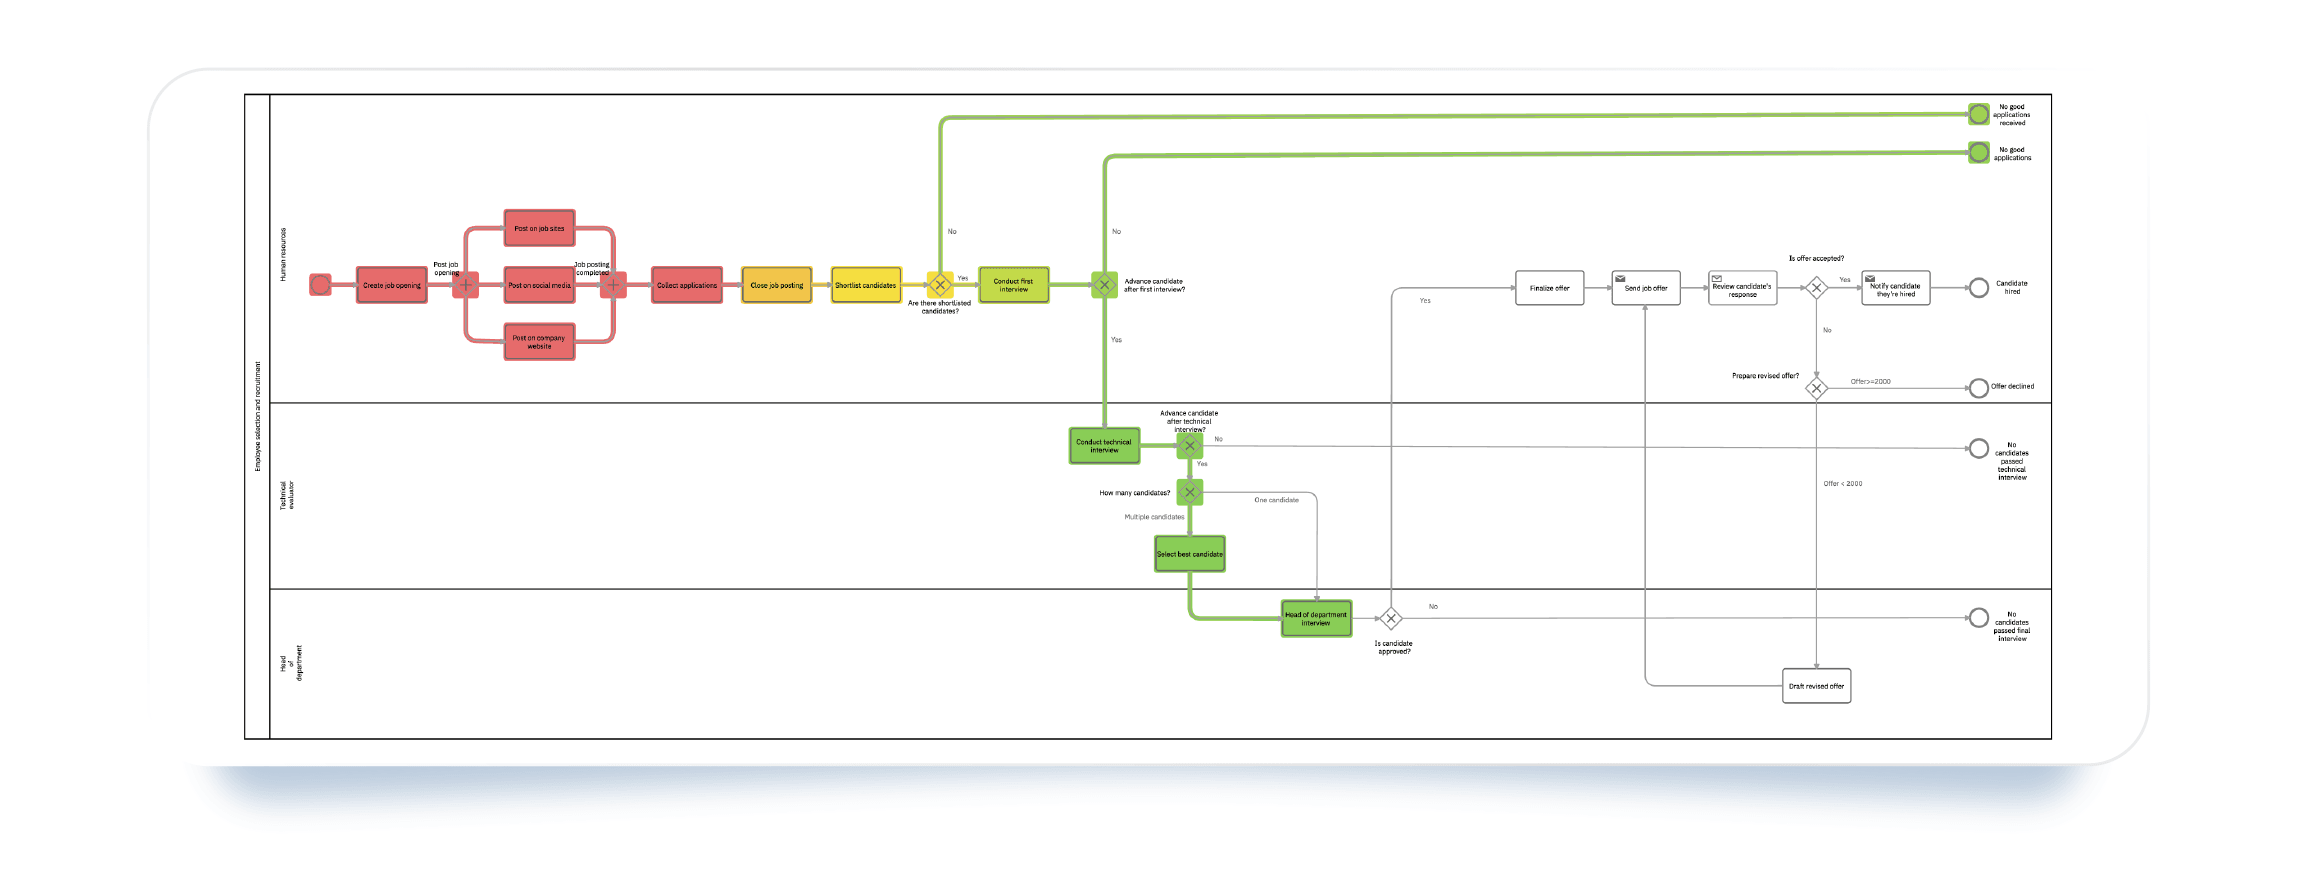
For example, imagine you want to improve how time is spent in a hiring process. Instead of making changes based on assumptions, you can model the current process, define relevant parameters, and run simulations. The results can then be analyzed using visualization tools to compare scenarios. You can adjust variables and re-run simulations until you identify the most effective option. These steps are described in detail in the simulation guide. Once the outcome meets your expectations, you can apply the decision with greater confidence in the real process.
In this way, business process simulation and data-driven decision making work together. The steps involved in simulation closely follow the DDDM approach, making it easier to move from data analysis to practical decisions.
Data visualization in Cardanit Business Process Simulation
Cardanit helps you make informed, data-backed decisions about your business processes. We have already seen how important clear data visualization is for understanding complex data, and the same applies to business process simulations.
With Cardanit, you do more than collect data when running simulations. You can analyze and explore simulation results directly using built-in visualization tools. This makes it easier to understand what is happening inside your processes and why.
Here is what you can use today:
- Interactive heatmap: Imagine a map of your business process where different parts light up with colors based on how a simulation performs. Red means "hot" (higher values), and green means "cool" (lower values). This chart helps you quickly see where processes slow down or get stuck.
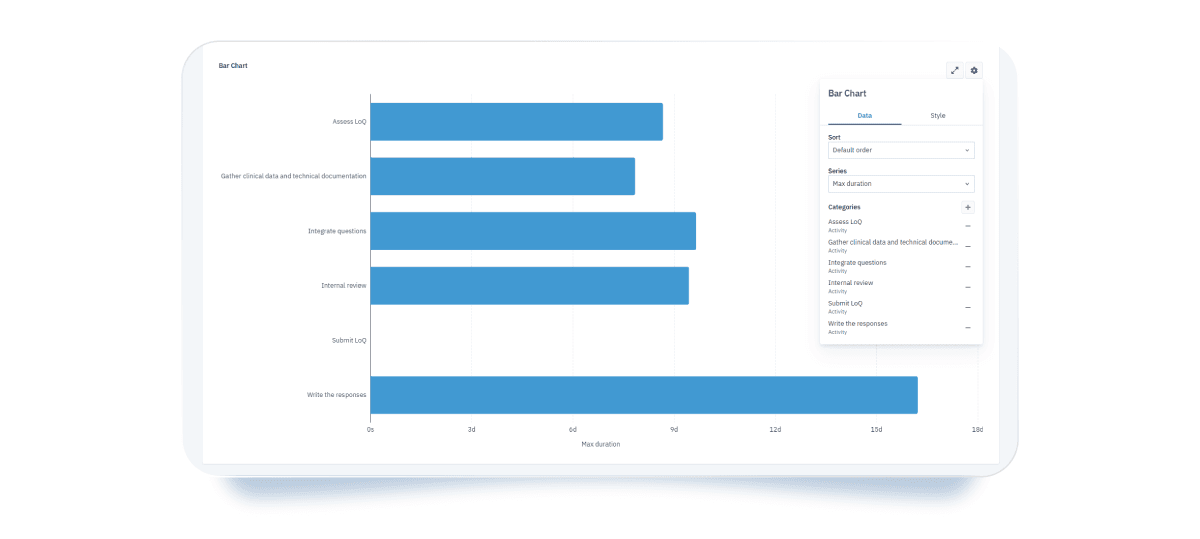
- Bar chart: This chart shows simulation results horizontally, so you can easily compare different parts of the process. You can spot trends and unusual values at a glance. You can also change how it looks, such as the colors, and choose whether to show gridlines.
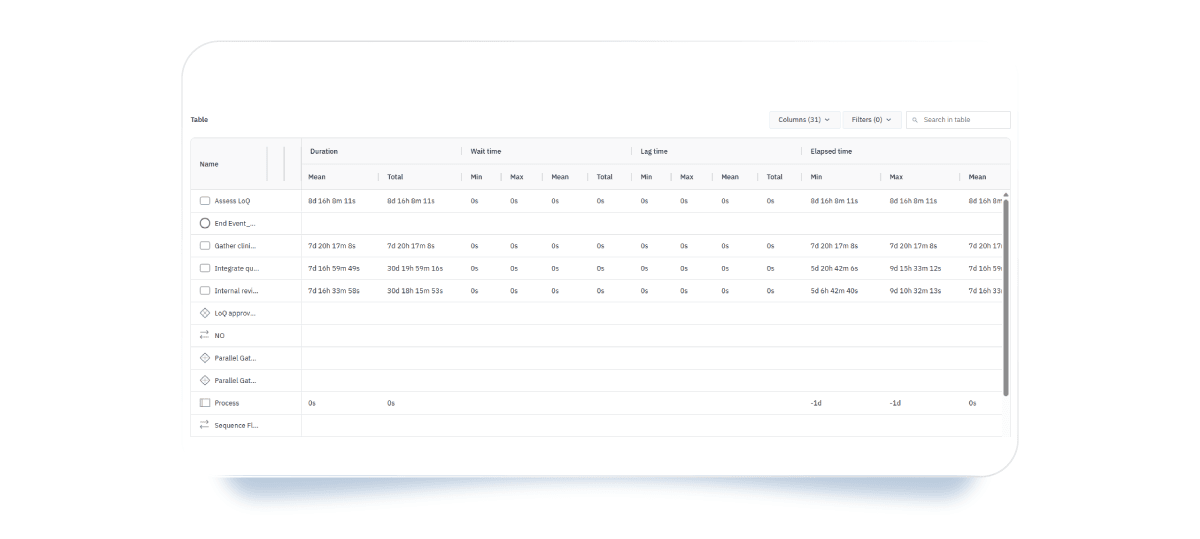
- Interactive tables: These tables show all results, but you can focus only on what matters. You can filter data, hide columns, and sort values from smallest to largest or the other way around.
Next steps in Cardanit data visualization
We are continuously expanding data visualization options in Cardanit business process simulations. The goal is to make simulation results easier to explore and interpret, especially as processes become more complex.
Future visualizations will focus on showing how performance changes over time, for example through Gantt charts, and how different process elements relate to each other, using views such as treemaps. These additions will support deeper analysis without adding unnecessary complexity.
As these features are introduced, they will help you make more confident, data-driven decisions based on simulation results.
Key takeaways:
- Data-driven decision making replaces assumptions with evidence.
- Business process simulation supports data-driven decisions by testing scenarios before implementation.
- In Business Process Management, simulation analyzes time, cost, resources, and performance.
- Digital twins enable realistic process simulation without affecting live operations.
- Data visualization clarifies simulation results, revealing patterns and bottlenecks.
- Simulation and visualization turn process data into actionable decisions.
Teresa Montrone joined ESTECO in 2013 for a PhD in Mathematics in collaboration with the University of Salento. She started belonging to the Numerical Method Group as researcher in optimization, response surface and Design of Experiments. After 8 years she took on the researcher and developer roles in the team developing Cardanit, till becoming Project Manager. She’s also been involved in research projects in the field of railways and transportation, applying her expertise in combinatorial methods, optimization and business process simulation. In 2025, Teresa got promoted to Product Manager, coordinating Cardanit development.
Teresa Montrone joined ESTECO in 2013 for a PhD in Mathematics in collaboration with the University of Salento. She started belonging to the Numerical Method Group as researcher in optimization, response surface and Design of Experiments. After 8 years she took on the researcher and developer roles in the team developing Cardanit, till becoming Project Manager. She’s also been involved in research projects in the field of railways and transportation, applying her expertise in combinatorial methods, optimization and business process simulation. In 2025, Teresa got promoted to Product Manager, coordinating Cardanit development.
People also ask
You should use business process simulation when you need to test decisions before implementing them. Traditional dashboards show what already happened, while simulation lets you explore what could happen under different conditions. Simulation is especially useful when changes involve risk, cost, or resource constraints. It helps you compare scenarios, predict outcomes, and understand trade-offs before acting.
Business process simulation works best for decisions that affect time, cost, resources, or process performance. This includes staffing changes, process redesigns, capacity planning, and policy adjustments. It is also valuable when decisions have system-wide effects, where improving one step may impact others. Simulation helps you see the full picture instead of isolated metrics.
You do not need perfect data to start. In most cases, you need basic process information, such as activity durations, resource availability, volumes, and decision rules. As simulations run, you can refine inputs and improve accuracy over time. With Cardanit, you can immediately explore simulation results using built-in data visualization tools, which makes it easier to understand how your data behaves and where refinements are needed. Therefore, simulation supports an iterative approach rather than requiring complete data upfront.
Business process simulation supports continuous improvement by allowing you to re-test processes as conditions change. You can run new scenarios when volumes increase, resources change, or goals evolve. Instead of relying on one-time analysis, simulation becomes an ongoing decision support tool. This helps teams adapt processes continuously while keeping decisions grounded in data.
A business is only as efficient as its processes. What are you waiting to improve yours?