
How to describe a business process for effective modeling in BPMN (step-by-step guide)
Written by Andrea
5 July 2023 · 12 min read

To model a business process in BPMN, you first need to describe how it works in real life, step by step. That starts with a clear, detailed understanding of what actually happens, who’s involved, and how the process flows from start to finish. But how do you go from written notes to a structured BPMN diagram?
In this guide, you’ll learn how to describe a business process from scratch and then turn that description into an effective model using BPMN (Business Process Model and Notation). We’ll walk through the full process using a simple example: delivering a pizza.
Along the way, you’ll also discover how a tool like Cardanit helps you model faster, avoid common mistakes, and collaborate more easily. Whether you’re new to process modeling or want a more structured approach, this guide will give you the steps to go from process notes to a clear, actionable BPMN diagram.
What is a business process?
A business process is a series of tasks or activities carried out in a specific order to achieve a goal. These tasks involve people, tools, data, and decisions, and together, they help organizations deliver a product or service.
Let’s take a simple example: delivering a pizza. The process begins when a customer places an order. From there, the pizzeria prepares the food, schedules delivery, and ensures the order reaches the customer. Each of these steps plays a role in completing the full process.
While this might sound straightforward, every process has hidden complexity, especially when people, tools, and systems interact. That’s why clear descriptions and visual models matter so much.
Why describing a process matters before modeling
Before you can model a process using BPMN, or any formal notation, you need to understand how things actually happen. That’s where process description comes in. It helps you build a complete picture before jumping into diagramming tools.
Describing a process helps you:
- Understand how tasks flow from one step to the next
- Spot inefficiencies, delays, or unclear responsibilities
- Clarify who’s involved and what inputs or decisions are required
- Align everyone on the same understanding before changes are proposed.
It also makes collaboration easier. A clear, informal description, written out or sketched, lets all stakeholders contribute, even if they’re unfamiliar with modeling techniques.
While BPMN is a powerful tool, starting with it too early can backfire. You risk focusing on the diagram’s structure instead of what’s actually happening in the process. That’s why many teams begin with a simple flowchart or even a whiteboard sketch.
A simple flowchart gives you just enough structure to explore the process clearly, involve others, and uncover issues, without worrying about technical rules. Here’s what it can help you do before moving on to formal modeling:
A flowchart helps you sketch the overall logic without worrying about BPMN rules. It keeps things simple so you can concentrate on what actually happens.
It’s easier for non-technical stakeholders to follow and contribute to informal diagrams.
Conversations often reveal exceptions, workarounds, or delays. These insights might be missed in formal modeling.
Jumping into BPMN too early can lead to overcomplicated models. A flowchart keeps you focused on clarity before layering in technical elements.
A validated flowchart makes it easier to build a BPMN diagram that reflects reality.
Once you’ve described the process clearly and validated it with others, you’re ready to move into modeling, this time with clarity and purpose.
How to describe a business process step by step (pizza delivery example)
Describing a business process involves more than listing a few tasks. You need to define what triggers the process, what it aims to deliver, who’s involved, and where potential problems may appear. Below is a structured way to do that, one step at a time.
We’ll use a simple pizza delivery process to show how each step works in practice.
Step 1 – Identify the main elements of the process
Start by giving the process a clear name. Use a verb-noun format like “Deliver pizza” instead of a vague label like “Pizza delivery.” This small change makes it clear that the process is action-driven and helps everyone better understand what’s happening. It’s also important to follow this format when naming all activities.
Next, define the input (what triggers the process) and the output (what signals it’s done). In our case:
- Input: a customer places an order
- Output: the customer receives the pizza
Then, list the main activities. For example:
- Taking the order
- Preparing the food
- Scheduling the delivery
- Delivering the pizza
At this stage, keep things simple. You’re laying the foundation for a deeper analysis, not modeling yet.
Step 2 – Draw the as-is process flow
Once you've outlined the key elements of the process, sketch a basic flow that shows how those elements work together. This is called the as-is process, a representation of how the process currently operates.
You don’t need to use BPMN at this stage. A simple flowchart or diagram works fine, especially while you're still focusing on understanding the process clearly, something we covered earlier. Just make sure it captures:
- The start and end points
- Each main activity or task
- Any key interactions or decision points
- The order of execution.
For the pizza delivery process, the as-is flow might look like this:
- Customer places an order by phone
- Order taker enters it into the system
- Kitchen staff prepare the pizza
- Delivery manager groups orders by area
- Driver picks up and delivers the order.
Drawing the as-is process helps spot gaps, delays, or unclear handoffs early. It also gives you a baseline for identifying improvements and later comparing with the to-be process.
Step 3 – Gather information about the process and its problems
Describing a process from a distance isn't enough. You need insights from the people involved, those who run it, manage it, or experience it firsthand. This step is about collecting detailed information to understand what works and where things break down.
Start by talking with stakeholders. These could include:
- Employees involved in each step
- Managers or supervisors
- Customers or service users (if possible)
- Supporting staff like IT or logistics
Ask questions like:
- Does the current flow reflect reality?
- Where do delays or issues usually happen?
- Are certain tasks skipped or repeated?
- What happens when something goes wrong?
Let’s go back to our pizza delivery example. On paper, everything might seem smooth. But after talking to the staff, you might learn:
- Some customers hang up because the phone lines are often busy
- Delivery drivers are frequently unavailable during peak hours
- Some routes take too long, and pizzas arrive cold.
These problems may not appear in the initial diagram, but they impact performance, customer satisfaction, and cost.
Documenting this kind of feedback gives you a fuller picture of the process and prepares you to model it more accurately. It also helps you identify which parts need to change and why.
Step 4 – Create a process scoping diagram
Once you've gathered feedback and identified potential issues, it's time to explore how the process interacts with its environment. This is where the process scoping diagram comes in.
A scoping diagram helps you see beyond the steps of the process. It captures inputs, outputs, controls, and supporting elements, giving you a broader view of what influences the process and where problems might originate.
This is especially helpful when preparing for process modeling, as it highlights external dependencies and shows which areas may need to be included in your diagram.
Here’s how the diagram is typically structured:
- Process area (center): the main process and its activities
- Input area (left): what triggers the process (e.g., customer orders)
- Output area (right): the result or outcome (e.g., delivered pizzas)
- Control area (top): rules, documents, or people that guide the process (e.g., delivery policy)
- Enabling area (bottom): tools, systems, or resources that support it (e.g., phones, vehicles)
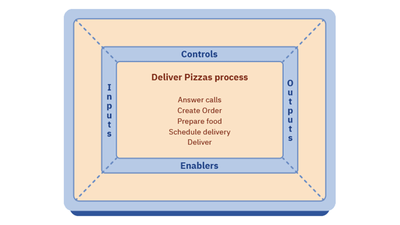
Let’s apply this to the pizza delivery process. You might discover:
- A shortage of order takers delays input
- Delivery guidelines are outdated or unclear
- Too few available vehicles during rush hour
You can make notes in each section of the diagram to reflect this input. That way, you’re not only identifying issues, you’re also visualizing how external factors shape the process.
What about cause-effect diagrams?
If you’re analyzing a very specific or minor issue, like why pizzas sometimes arrive cold, a simple cause-effect diagram (also known as a fishbone or Ishikawa diagram) might be enough. But for broader problems or when scoping a full process, the process scoping diagram offers more flexibility and context.
This kind of analysis often leads to broader process redesigns, especially when the original scope turns out to be too narrow. The scoping diagram helps justify those changes and keeps everyone aligned.
Step 5 – Build a business case for process change
By now, you’ve described the current (as-is) process, identified key problems, and explored its environment. The next step is to define why the process should change, and what a better version would look like. This is where the business case comes in.
A strong business case outlines:
- What the process looks like today (and what’s wrong with it)
- What the improved version should achieve
- How the team plans to bridge the gap
- What it will cost, and what risks are involved.
In the pizza delivery example, your case might focus on speeding up order handling and avoiding late deliveries. It could include:
- As-is analysis: long call wait times, delayed routes, cold food
- To-be goals: faster ordering via an app, optimized delivery scheduling
- Improvement plan: add online ordering, restructure delivery zones
- Resources needed: app development, route-planning software, training
- Risks: slow adoption, budget constraints, resistance from staff.
At this stage, you’re not modeling the new process yet, but you are defining the why behind it. That clarity will guide the design of your to-be process diagram and help align stakeholders early on.
Once approved, the business case becomes your reference point. It ensures that modeling and improvement efforts stay focused on the right outcomes, not just on visual changes, but real operational gains.
Step 6 – Draw the to-be process
With the business case in place, you’re ready to define the improved version of the process. This is called the to-be process, a diagram that shows how the process should work after changes are implemented.
Start by revisiting your as-is flow and identifying what needs to change. Look at the problems you uncovered and the goals outlined in the business case. From there, sketch one or more alternative workflows that address those issues.
Eventually, you’ll select the best option and draw the to-be process in more detail.
Let’s go back to the pizza delivery example. In the to-be version, your process might include:
- A mobile app for customers to place orders directly
- Orders entered automatically into the system
- Prepaid orders to reduce delays at delivery
- Real-time order tracking for customers
- Optimized delivery routes using customer location data
Compared to the as-is version, the new flow should feel simpler, faster, and more aligned with customer needs. It may also shift responsibilities - for example, reducing the workload on phone operators and improving communication between kitchen staff and delivery drivers.
Later in this guide, you’ll learn how to turn that to-be process into a formal BPMN diagram using modeling tools like Cardanit. But for now, this step completes the process description phase. You’ve gone from understanding how things work today to defining how they should work tomorrow.
From description to model: where BPMN comes in
Sketches and informal flowcharts are great for early discussions. They help teams understand the process and spot basic issues. But if you want to improve, automate, or scale the process, you need more than a rough draft.
Formal BPMN modeling gives your process a clear structure, removes ambiguity, and makes responsibilities and decision points visible to everyone. BPMN 2.0 also supports validation, simulation, and standardization - things that informal diagrams can’t do. Without this step, even a well-described process may stay stuck in theory instead of moving into action.
So, how do you move from a written description to a structured BPMN model? It starts by identifying how each task, decision, and participant fits into BPMN’s standardized elements.
Mapping your process description to BPMN elements
Here’s a simple breakdown of how core parts of your process description typically map to BPMN elements:
- Start and end points → Start Event and End Event
- Actions or tasks → Tasks
- Decisions or conditions → Gateways
- Involved people or systems → Lanes and Pools
- Delays, data, or exceptions → Events or Data Objects
Let’s go back to our pizza delivery example to make this more concrete:
- “Customer places an order” becomes a Start Event
- “Prepare pizza” is a Task
- “Order by app or phone?” can be modeled with a Gateway
- “Delivery staff” and “Kitchen staff” could each have their own Lane.
These mappings help turn a rough process sketch into a structured BPMN workflow that’s easier to understand, share, and refine. From here, you can begin building your diagram with a clearer structure and fewer uncertainties.
To support that, the table below gives a detailed view of how each part of the written pizza delivery process description translates into a BPMN element. This is especially helpful if you're new to BPMN and want to understand the reasoning behind each modeling choice.
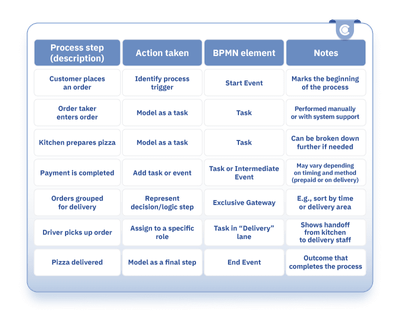
This kind of structured mapping bridges the gap between informal descriptions and formal models. It’s one of the simplest ways to make your first BPMN diagram not just correct, but meaningful.
Visualizing the process in BPMN
Now let’s look at what the full BPMN diagrams could look like using a professional process modeling tool like Cardanit.
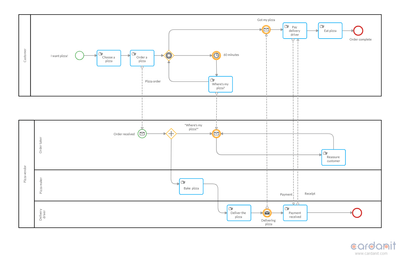
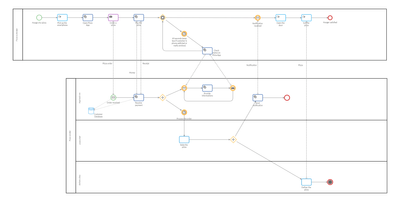
As-is process diagram of the pizza delivery process
This version shows how the pizza delivery process works today, with all current steps and known inefficiencies.
This future-state version reflects the proposed improvements, such as automated ordering, online payments, and optimized delivery routes.
These diagrams do more than just illustrate tasks. They show flow, responsibility, decision points, and system interactions. And when built in a BPMN modeler like Cardanit, they’re easy to update, refine, and reuse.
Want to explore the diagrams hands-on? Use our pizza delivery process template to see how the as-is and to-be processes look in Cardanit. You can use it as a starting point to experiment, customize, or build your own models.
Tools that help: modeling your process faster with Cardanit
You’ve seen how a process description turns into a BPMN diagram, and how clear modeling helps highlight improvements. To do this effectively, you need a tool that supports both structure and speed.
Cardanit is designed specifically for that. It’s cloud-based, user-friendly, and built to support real-world processes, whether you’re working on a simple task flow or a more complex cross-department scenario.
Here’s what you can do with it:
- Add BPMN elements like tasks, events, and gateways with just a few clicks
- Use lanes and pools to organize responsibilities across teams
- Define data flow with data objects and connectors
- Apply auto-layout to clean up your diagram in one go
- Export diagrams as PDF or PNG for sharing
- Auto-generate a comprehensive BPMN report of your process model
- Collaborate with your team in real time or asynchronously.
Need help understanding BPMN elements while modeling? You can refer to Cardanit’s helpful resources:
- Introduction to BPMN 2.0 - An overview of the main BPMN elements, diagrams, and limitation
- BPMN glossary – Quick definitions for all the core terms
- BPMN 2.0 cheatsheet – A free, downloadable guide for beginners and pros alike
Whether you're creating an as-is diagram to document how things work today or a to-be diagram to design a better version, Cardanit gives you the structure and flexibility you need to model clearly and quickly.
Real-world examples of BPMN modeling in action
Process modeling isn’t just for theory or internal documentation. It’s used across industries to improve operations, reduce errors, and support digital transformation. Below are a few real-world examples where BPMN helped teams understand and improve how their work gets done, with the support of Cardanit.
Public sector: streamlining IT processes
In public administration, IT support processes were often unclear and poorly documented. CPAS, a Belgian organization, used BPMN to visualize handoffs between teams, which led to faster response times and clearer roles across departments.
Logistics: optimizing port transportation
To improve coordination between ships, trucks, and terminal staff, an Italian port authority modeled its intermodal transport process with BPMN. The diagram helped align stakeholders and expose bottlenecks in real time operations.
Healthcare: improving corporate procedures
In the healthcare sector, EUC Premium, a Czech organization, used BPMN to redesign internal procedures, reducing cross-department friction and improving process documentation for compliance and safety.
These examples show how BPMN modeling, when combined with the right tools, can make even the most complex processes easier to understand, manage, and improve.
In conclusion
Every effective BPMN model starts with a clear understanding of the real-world process behind it. By describing each step, identifying issues, and mapping out improvements, you can create models that drive real change, not just look good on paper.
Whether you're working on a pizza delivery flow or a complex enterprise process, tools like Cardanit make it easier to move from description to diagram with clarity and speed.
Ready to model your first process? Sign up for Cardanit and start creating BPMN diagrams right in your browser, no installation needed.
Further reading
Free BPMN 2.0 cheat sheet for easy process modeling
BPMN in public administration: Translating law-driven procedures in BPMN diagrams
Supply chain process management: Modeling end-to-end processes with BPMN
Andrea is the collective pseudonym for the group of people working behind Cardanit, the Business Process Management Software as a Service of ESTECO. The group has different backgrounds and several decades of experience in fields varying from BPM, BPMN, DMN, Process Mining, Simulation, Optimization, Numerical Methods, Research and Development, and Marketing.
Andrea is the collective pseudonym for the group of people working behind Cardanit, the Business Process Management Software as a Service of ESTECO. The group has different backgrounds and several decades of experience in fields varying from BPM, BPMN, DMN, Process Mining, Simulation, Optimization, Numerical Methods, Research and Development, and Marketing.
People also ask
If your process description clearly outlines the trigger, steps, roles involved, and outcome, and has been reviewed by key stakeholders, you’re ready to model it in BPMN. A quick way to test this is to sketch a flowchart. If it makes sense, you can confidently move into structured modeling.
Manual diagrams are helpful early on, but they can be hard to scale, share, or validate. A BPMN tool like Cardanit ensures your process diagrams follow standard rules, stay consistent, and are easy to update over time. You also get built-in features that support collaboration, automatic formatting, and export options—things that save time and reduce errors when working with teams or presenting to stakeholders.
Yes. Cardanit lets you model your current process (as-is) and design improved versions (to-be) in the same workspace. You can compare the two, refine workflows, and share diagrams with your team. And, with process simulation, you can test proposed changes before implementation. This helps you evaluate outcomes, spot issues early, and make better decisions based on data.
Not at all. Cardanit is designed for beginners and experts alike. It helps you model processes step by step, with built-in support and visual cues that make BPMN easier to learn as you go.
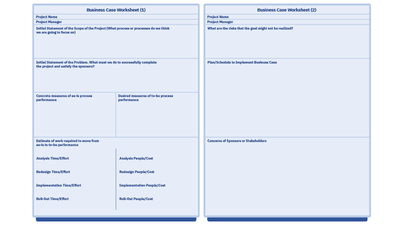
Our business case worksheet can help you describe the as-is business process and suggest the changes required to create a new, improved to-be version of it.
Want to start a business process change project?
Our business case worksheet can help you describe the as-is business process and suggest the changes required to create a new, improved to-be version of it.
Want to start a business process change project?
Our business case worksheet can help you describe the as-is business process and suggest the changes required to create a new, improved to-be version of it.