21 February, 2025
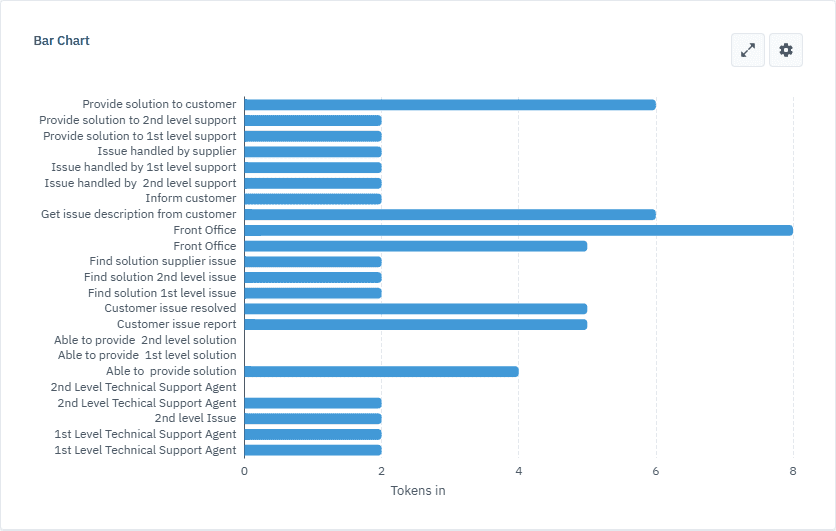
Introducing the Bar Chart widget
We’ve added a new Bar Chart widget to our Simulation environment, giving you a powerful new way to visualize your data. With this addition, you can now quickly analyze and compare key metrics across different process elements, helping you identify trends and make data-driven decisions.
Start using the Bar Chart widget today to get a better understanding of your process performance.
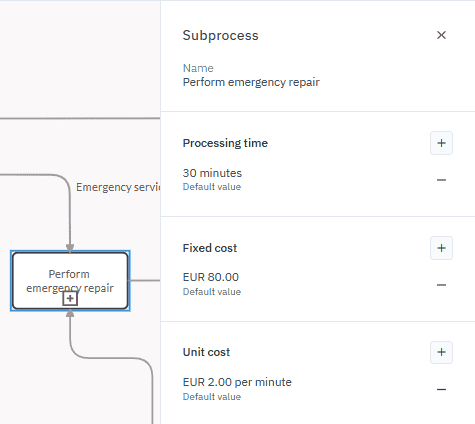
Set costs for subprocesses and call activities
You can now define both fixed and unit costs for subprocesses and call activities within your process. This enhancement gives you better control over the cost structure in your simulations, allowing for more accurate financial modeling.