Processes
Diagrams are where you map and edit processes.
You can have multiple processes in the one diagram or spread them over multiple diagrams to avoid oversized processes that are difficult to read.
Tour the Design page
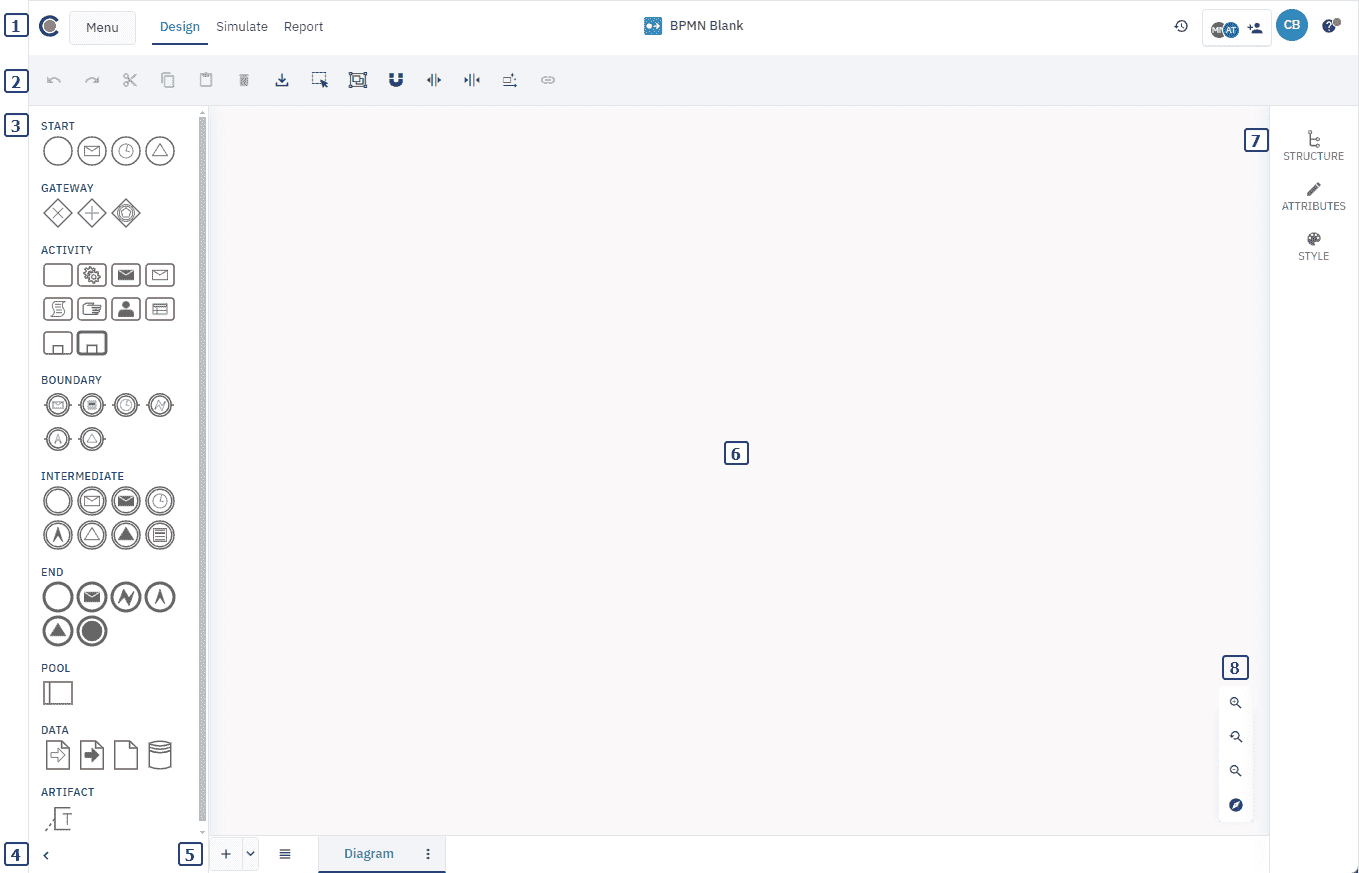
Before you start, it’s worthwhile getting to know the layout of the BPMN Design page. The Design page is where you map and edit processes.
-
Header:
-
Cardanit logo: click to go to the Home page.
-
Menu: Go to My Files, rename the project, and navigate to the Simulations page which lists the simulations that have been run.
-
A tab menu that gives you access to the Design, Simulation and Report pages.
-
The project name.
-
Access to version history.
-
See who the project is shared with and share the project with others.
-
View your profile.
-
Access the help section.
-
-
Toolbar
Use the toolbar to access key functions. Select the
icon to open the Navigation panel. The toolbar also includes options for editing the BPMN model and downloading the diagram or model screenshot. -
Navigation panel
The Navigation panel provides access to the Elements and Definitions tabs. Elements contains the elements you can use to map your model. Definitions lets you view and configure global process definitions.
-
Diagram
This is where you create, map and edit your processes.
-
Configuration panel
Navigate and customize your BPMN model. The Structure tab lets you explore the process structure, while the Attributes and Style tabs allow you to configure element properties and appearance.
-
View toolbar
The View toolbar provides tools to adjust your view of the diagram. Use it to zoom in, zoom out, reset the view, or open the mini-map for easier navigation of large or complex diagrams.
-
Diagram tab bar
Manage and switch between multiple BPMN diagrams. Add new diagrams, rename them and switch between diagrams.
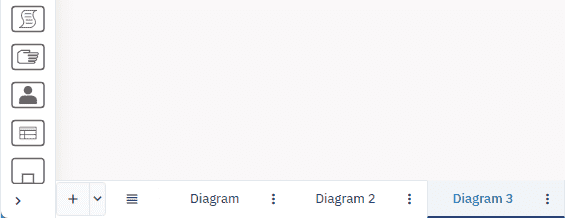
Manage diagrams
You can add, rename and delete diagrams and move diagram tabs in the sequence you prefer.
You perform these actions in the diagram tab menu at the bottom of the diagram.
If you have lots of diagrams, click
Add a diagram
To add a diagram:
-
In the diagram tab bar, click
. This places the diagram at the end.
You can also choose where to add a diagram: at the start, at the end, right or left.
- In the diagram tab bar, click
and select an option.
Rename a diagram
-
Click
, then click Rename. -
In the dialog box that opens, give a name to the diagram, then click Ok.
Delete a diagram
If you delete a diagram it can’t be restored.
- Click
, then click Delete.
Move diagram tabs
You can move diagram tabs in the sequence you prefer: left,right, to the start or end.
- Click
, then click Move right, Move left, Move to start or Move to end.
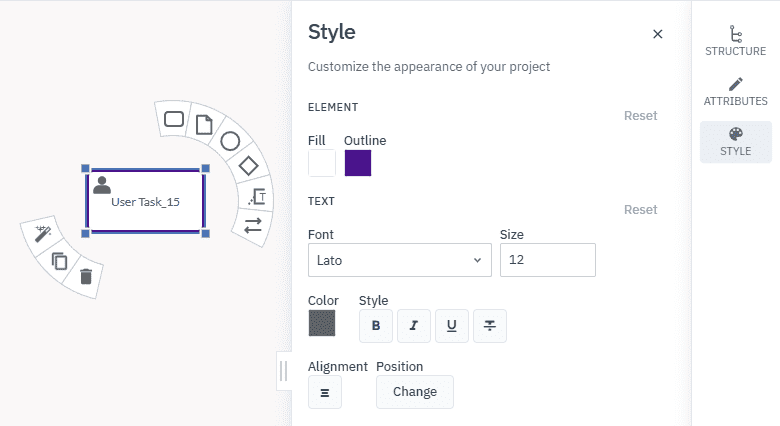
Format diagrams
You can customize the appearance of elements, connecting elements and labels to make your diagram clearer and easier to read.
Format an individual item
-
Select the item.
-
In the Configuration panel, click Style.
Format multiple items
To format multiple items of the same type — for example, all tasks in the diagram:
-
Press Shift, then select all the items you want to format.
Style panel options
Depending on the type of element you want to change, you have these formatting options:
Nodes
Format the color of elements.
-
Fill: color the inside of an element.
-
Stroke: color the outline of an element.
Text
Format label text and paragraph styles.
-
Text: change the font type, font size, color and text style.
-
Paragraph: align text and position.
Edge
Format the appearance of Sequence Flows, Message Flows and Data Associations.
-
Line: Choose between straight and elbow.
-
Radius: Change the curve radius.
-
Color: Color the line.
Configure process definitions
Definitions is the root container for all the processes and elements in a BPMN model. They describe the non-visual components of a process. Unlike elements, which appear as shapes in a diagram, definitions represent underlying data or behavior that support the process — such as resources or messages.
Cardanit automatically detects and lists all the process definitions in the BPMN model.
You mange definitions in the Definitions tab of the Navigation panel.
To access the Definitions tab:
-
In the toolbar, click
to open the Navigation panel. -
Open the Definitions tab.
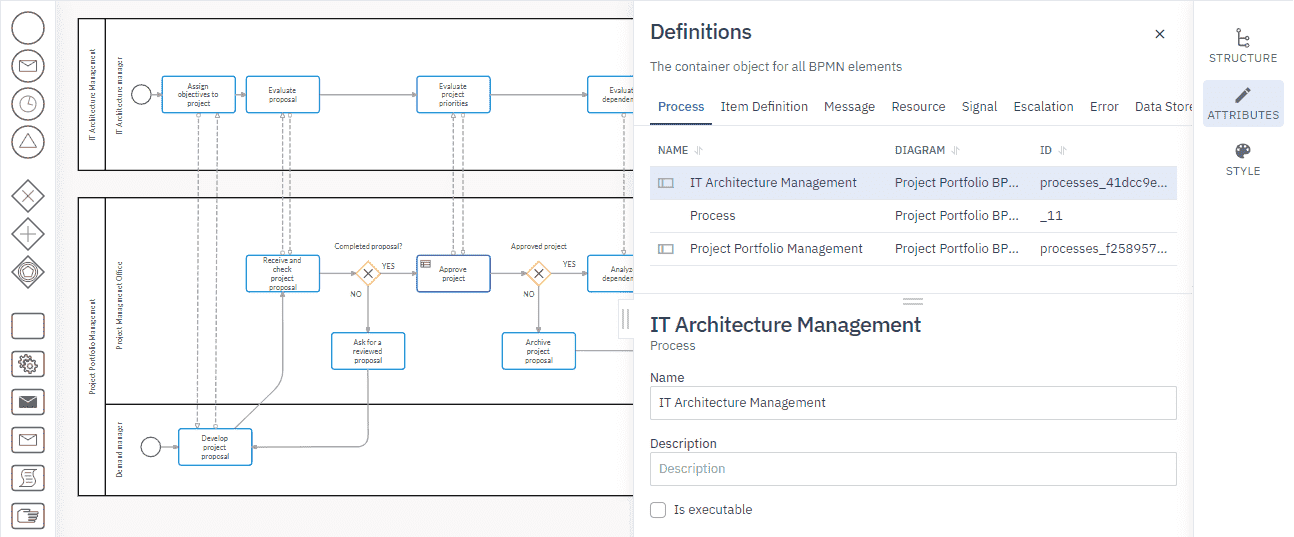
The definitions you can define for a process are:
| Definition | Description |
|---|---|
| Item definition | The types of data you can use in a BPMN model. |
| Message | The messages that are sent or received by a participant at the start, end, or during a process. |
| Resource | The resources that perform or are responsible for the activity. |
| Signal | Signals that are broadcast to everyone involved in the process. |
| Escalation | Escalations that a process might need to react to. |
| Error | The possible errors that can occur in the process. |
| Data Store | The data stores that are visualized by activities in the process. |
Add a definition
-
In the Definitions tab, click
next to the type of definition you want to add. A new definition is added with a default name. We recommend you give the new definition a meaningful name.
-
Select the new definition to edit its attributes.
Edit a definition
- Select the definition and edit the attributes as needed.
Remove a definition
- Click
next to the definition you want to remove.
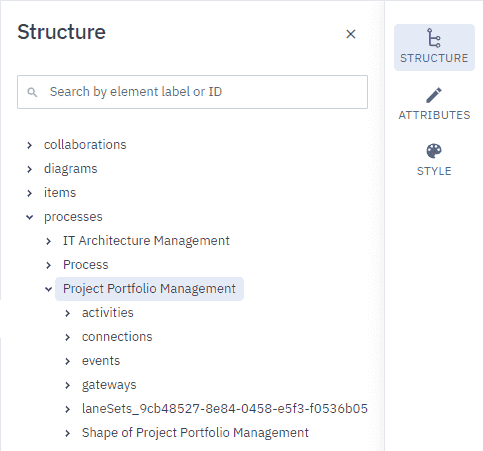
Explore process structure
The Structure panel displays all the aspects of a diagram in a real time, alphabetically ordered tree.
-
When you add or remove items in a diagram, the Structure panel updates automatically.
-
When you select an element in the diagram, the corresponding element is highlighted in the tree.
After selecting an element in the diagram, you can open the Attributes panel to define its attributes.
Use Search in the Structure panel to quickly locate a specific item in the diagram.
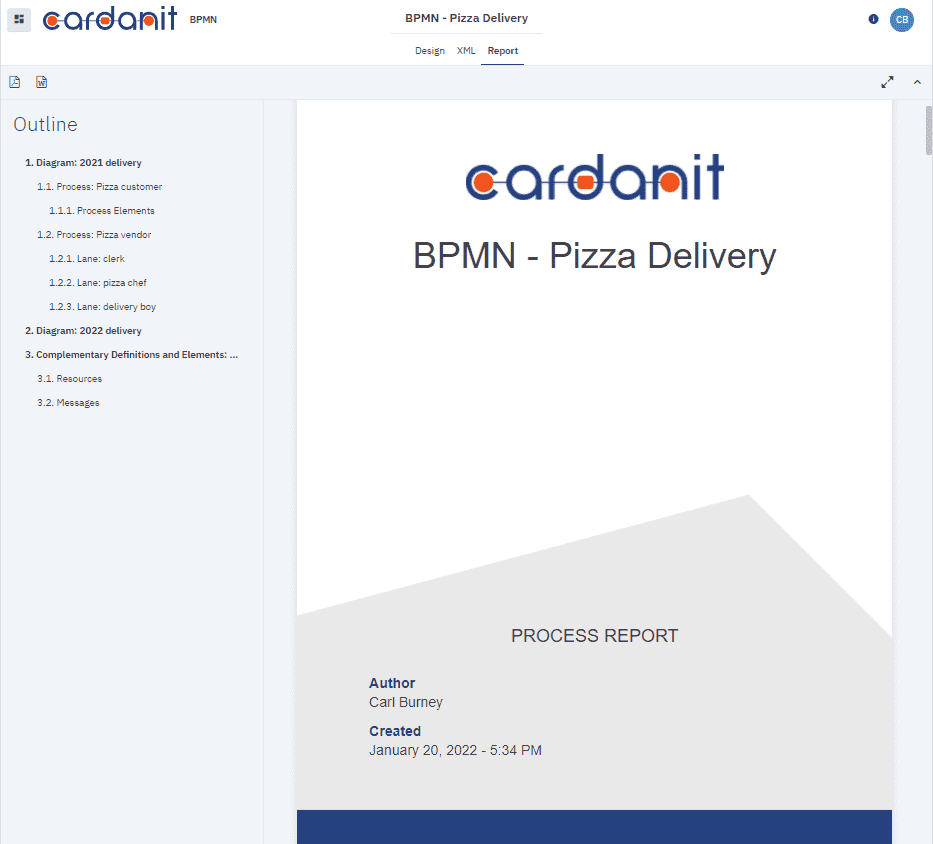
View the process report
Cardanit generates a comprehensive process report that enables you to analyze processes offline in a familiar format.
The report is generated in real time and contains all the diagrams in the process. It includes everything from attributes and definitions to diagram graphics and images.
For a complete report, remember to include a description in the Attributes panel for every element in the diagram.
To view the report:
- In the header, open the Report tab.
Download the report
The process report is available in Microsoft Word DOCX and Adobe PDF format.
-
In the toolbar, click
. -
Select the file format.
Download BPMN model
You can download the model as a BPMN 2.0 XML file to back up your work or to use with other BPMN-compatible software.
You download BPMN 2.0 XML files on the Design and Simulate pages.
To download a model:
-
In the toolbar, click
. -
Select BPMN model.
Download diagram image
You can download an image of a single diagram or multiple diagrams as a PDF or PNG file.
You download diagram images from the Design page.
To download a diagram image:
-
In the toolbar, click
. -
In the dialog box that opens, select:
-
The diagrams to include.
-
The file format.
-
Whether to show or hide project information and watermark.
-
-
Click Download.